Exploring the Dow Jones
Scraped and cleaned company data into a SQLite database, then built interactive dashboards in Power BI and Tableau.
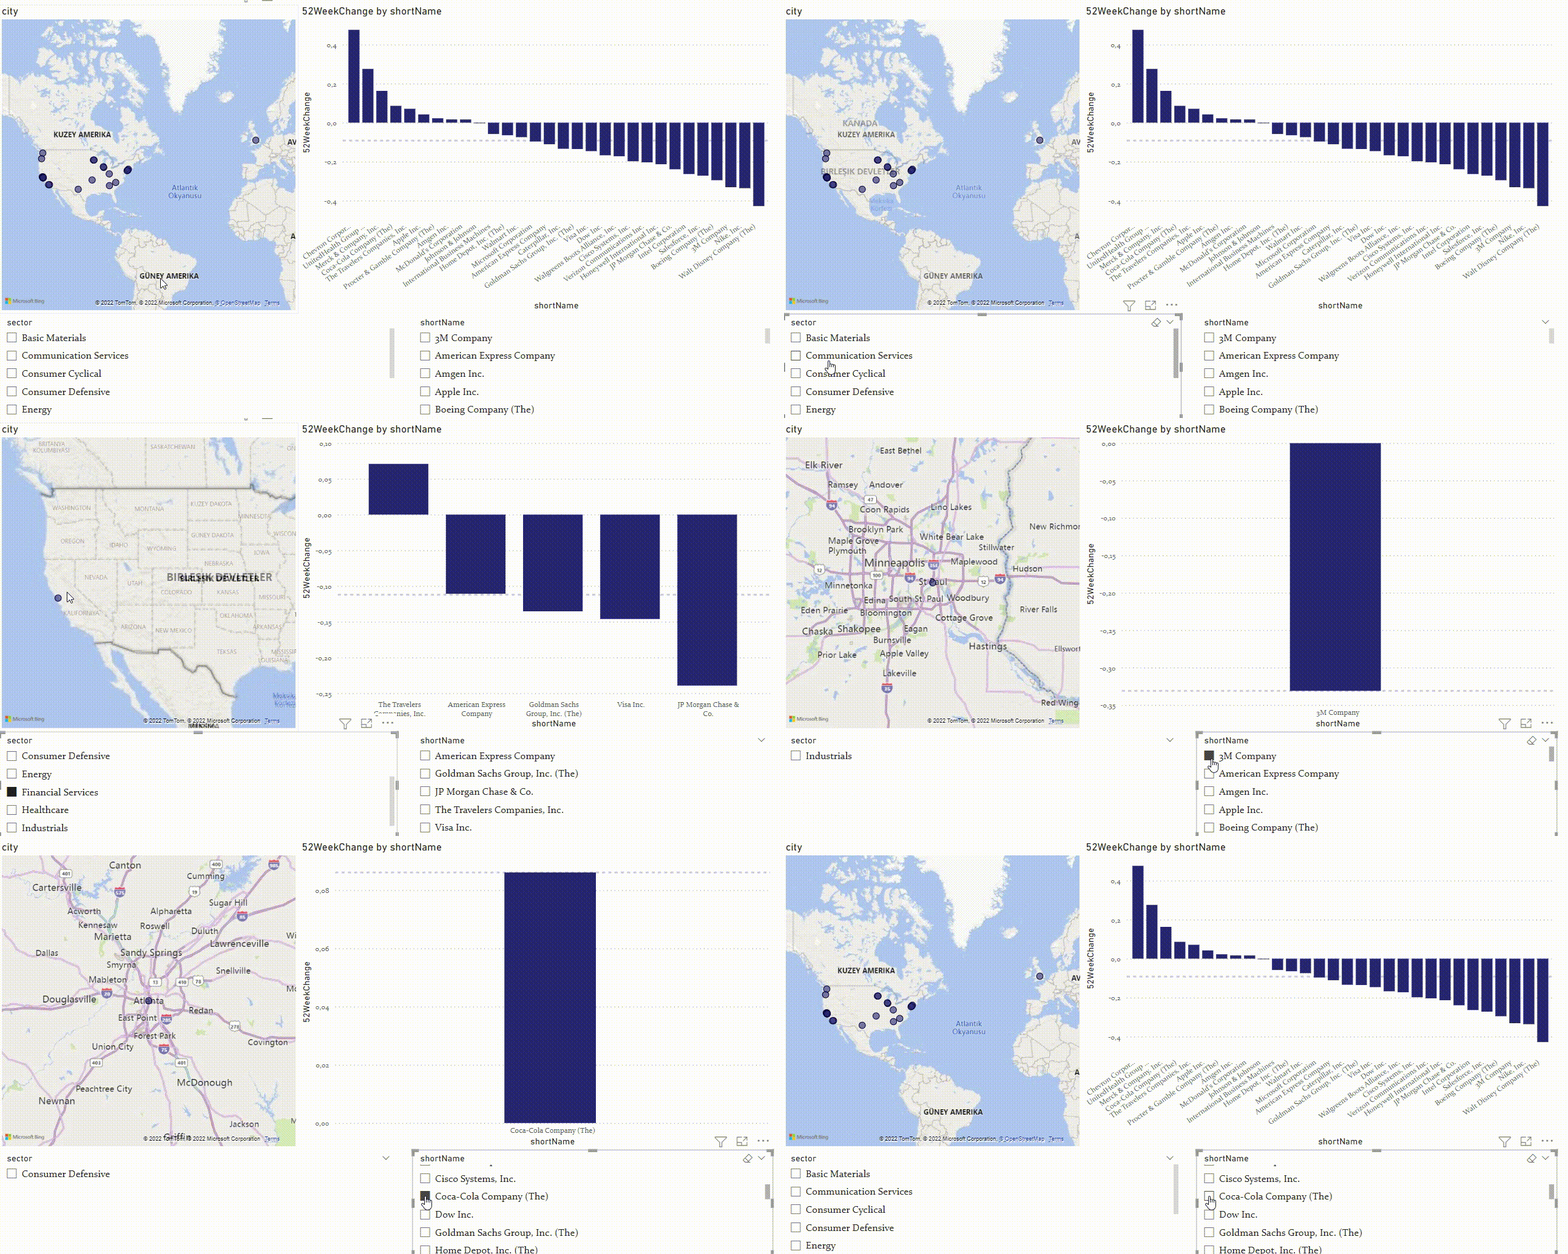
The Dow Jones Industrial Average is a stock market index of 30 prominent companies listed on US exchanges. In this project I collect data on the companies in the index by web scraping (Pandas and Yahoo Finance), clean it and build a database with Python. Interactive dashboards on top of it are built in Microsoft Power BI and Tableau.
A few rows and columns of the resulting company table:
| zip | sector | fullTimeEmployees | city | state | country | website | |
|---|---|---|---|---|---|---|---|
| 1 | 10285 | Financial Services | 64000 | New York | NY | United States | americanexpress.com |
| 2 | 91320-1799 | Healthcare | 24200 | Thousand Oaks | CA | United States | amgen.com |
| 3 | 95014 | Technology | 154000 | Cupertino | CA | United States | apple.com |
| 4 | 60606-1596 | Industrials | 142000 | Chicago | IL | United States | boeing.com |