Market data toolkit
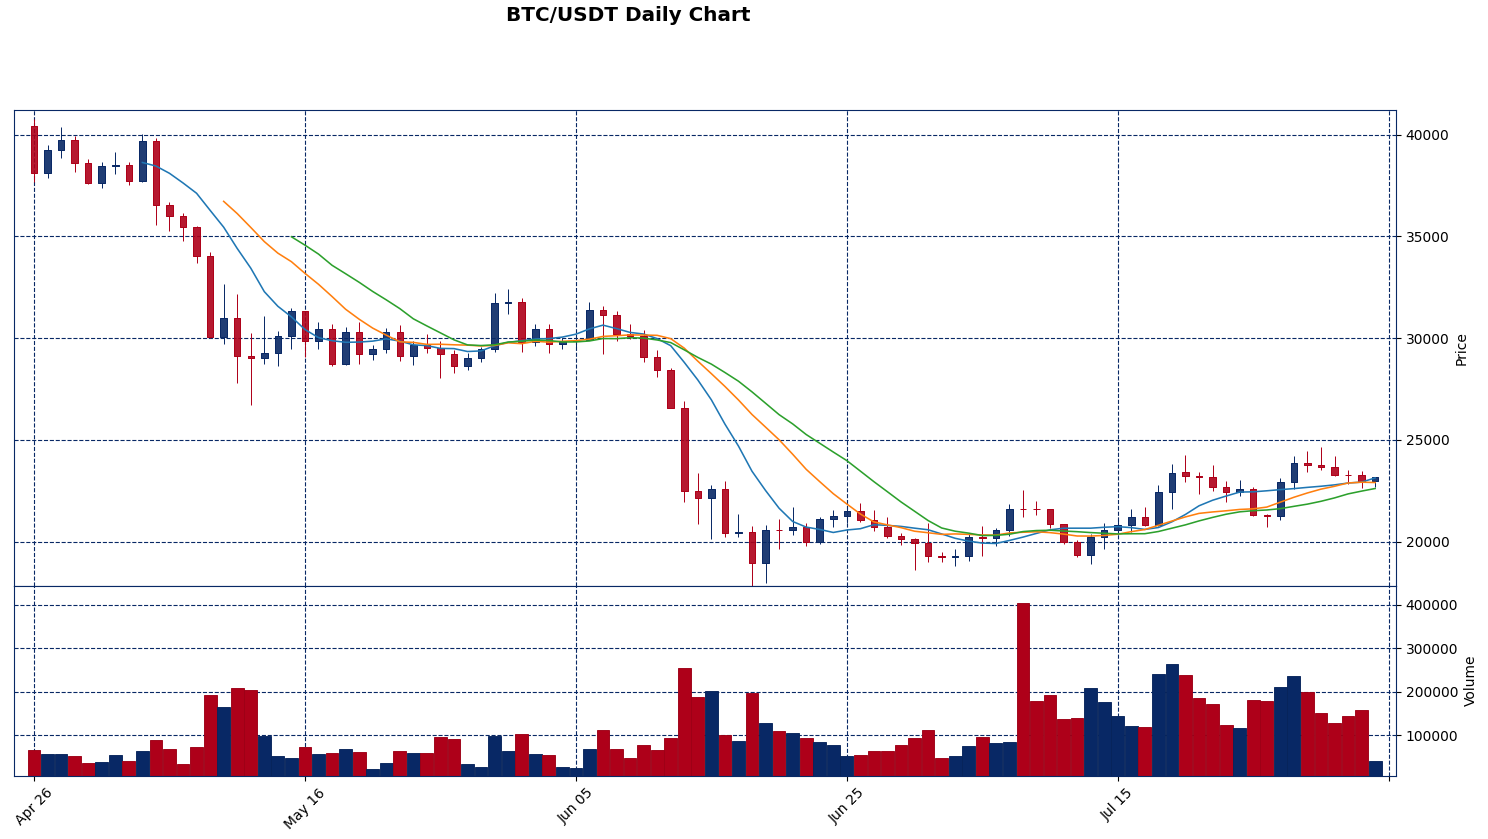
Candlestick data from exchange APIs, indicators such as RSI and MACD, and charts delivered through a Telegram bot.
Technical analysis of stock and crypto markets. The toolkit pulls candlestick data through exchange APIs, works on it with Pandas and technical-analysis libraries, and plots candlestick charts overlaid with indicators (RSI, MACD, moving averages) using Matplotlib, Seaborn and Plotly. The same charts are available on request through a Telegram bot.